Chapter 17.3 (Mathematics 5)

Interpretation of Data Represented through Piling

Interpretation of data represented through piling

Example 3

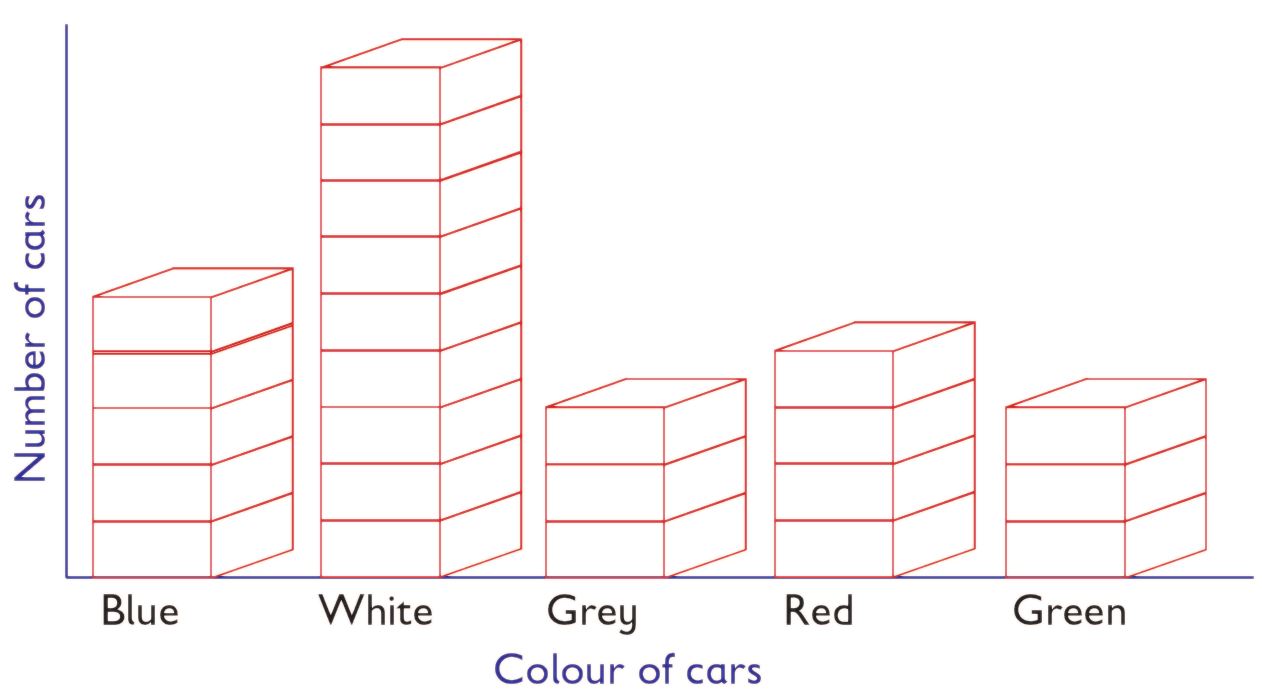
Omari and Awiti represented the colours of cars that passed by their school gate one afternoon. The information was represented using blocks of wood as shown.

Use the diagram to answer the following questions:

  1. How many white cars passed by the gate?
    Answer. White cars were 9.
  2. Which two colours had the same number of cars that passed by the gate?
    Answer. Grey and green.
  3. How many more blue cars than red cars passed by the gate?
    Answer. Blue 5, red 4. Difference is 5 – 4 = 1
  4. How many vehicles passed by the school gate altogether?
    Answer. Blue 5, white 9, grey 3, red 4, green 3.
    Total number of cars is

 5 + 9 + 3 + 4 + 3 = 24
Exercise E

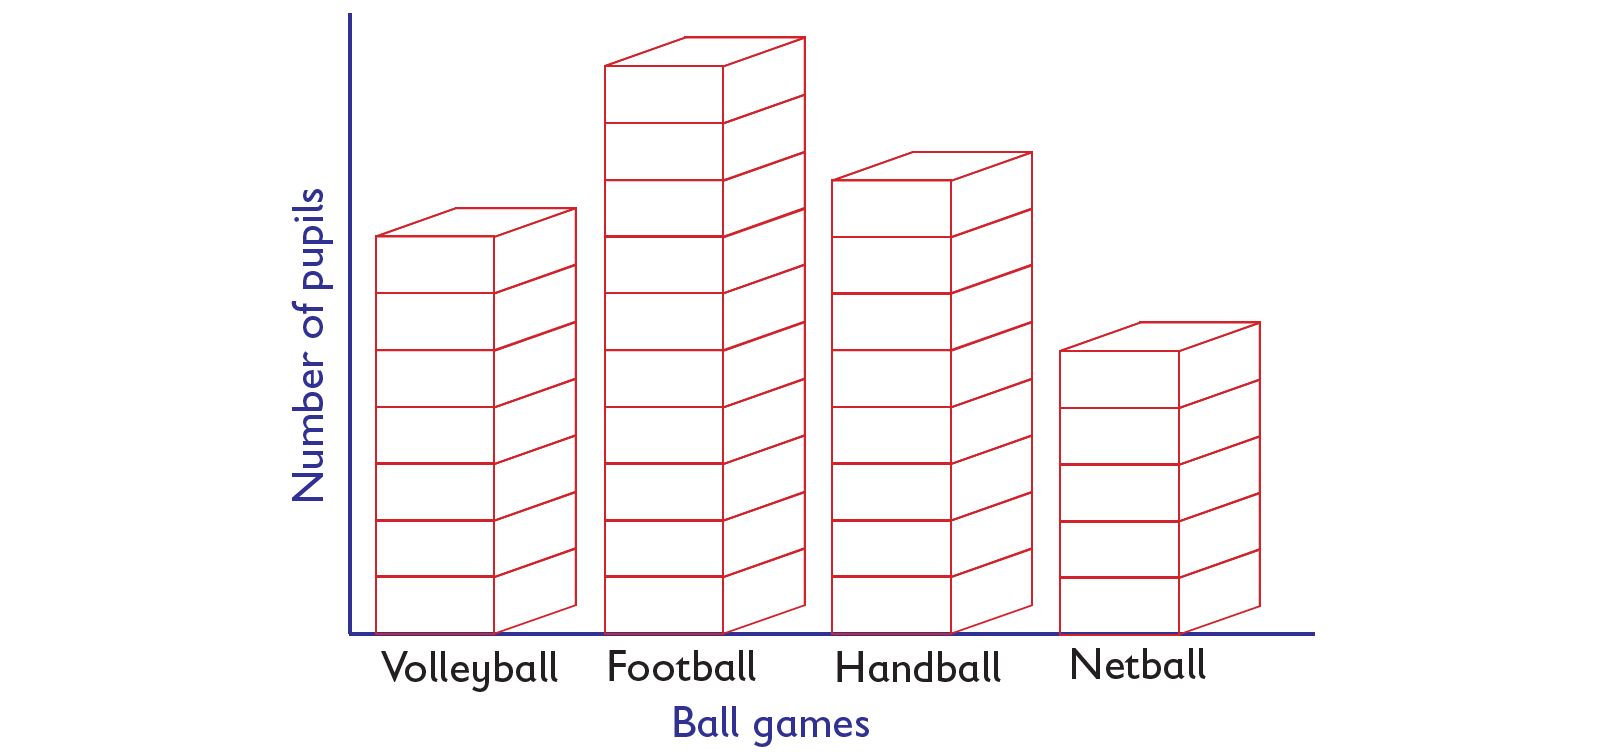
  1. Which game was liked most?
    Answer
  2. How many pupils had handball as their favourite game?
    Answer
  3. How many more pupils liked volleyball than netball?
    Answer
  4. How many pupils were in Grade Five class?
    Answer
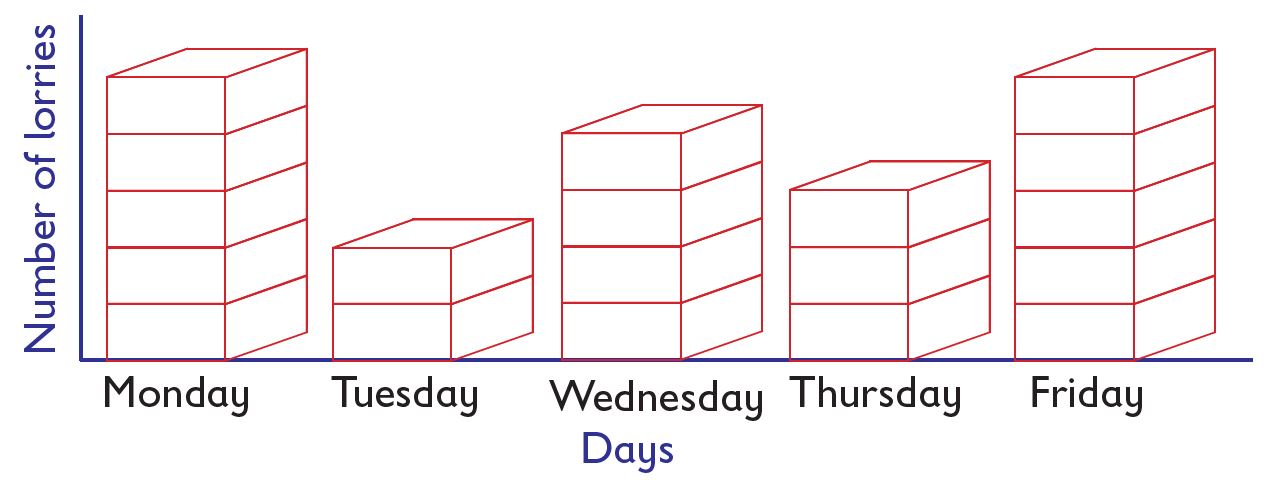
  1. How many lorries collected litter on Monday?
    Answer
  2. How many more lorries collected litter on Wednesday than Thursday?
    Answer
  3. On which days were the number of lorries the same?
  • Mon
  • Tue
  • Wed
  • Thur
  • Fri
  1. How many lorries collected litter for the five days?
    Answer
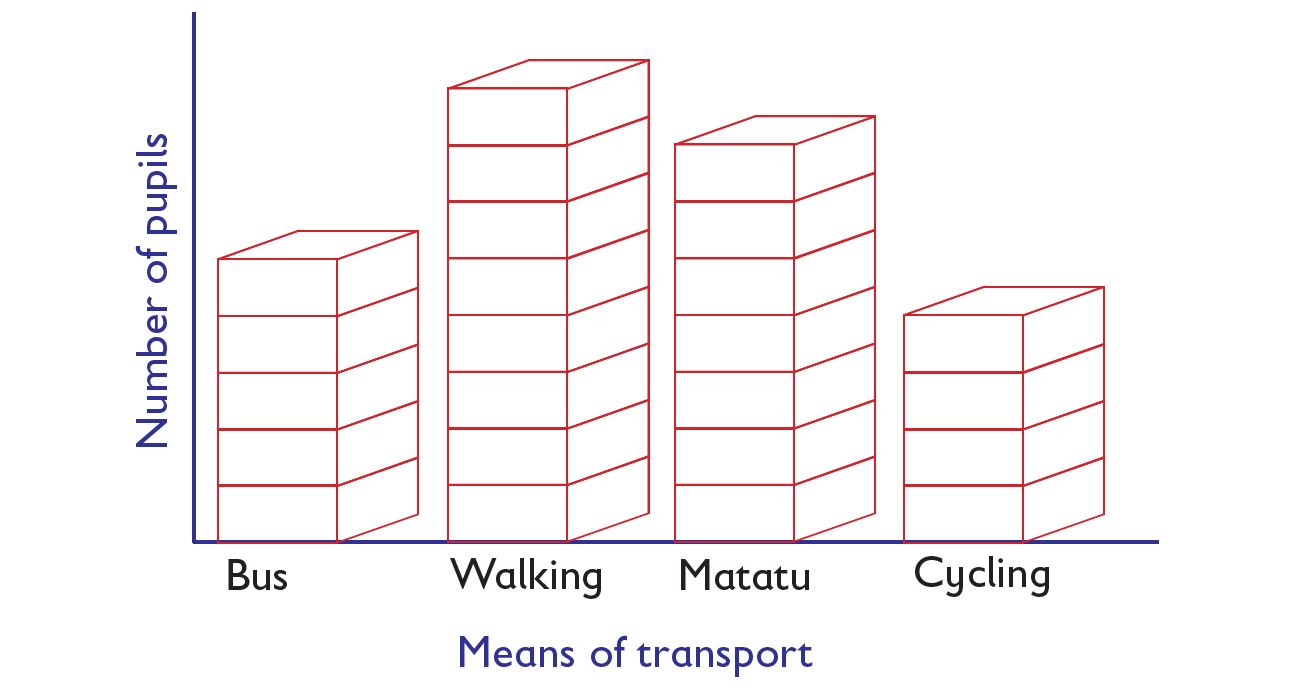
  1. How do most pupils come to school?
    Answer
  2. How did the seven pupils come to school?
    Answer
  3. Mark two methods of going to school used by many pupils?
  • Bus
  • Walking
  • Matatu
  • Cycling
  1. What fraction of the pupils in the whole class walked to school?
    Answer  or 

E5

Use IT devices to learn more on representation of data by piling.

Another example 

Example 4

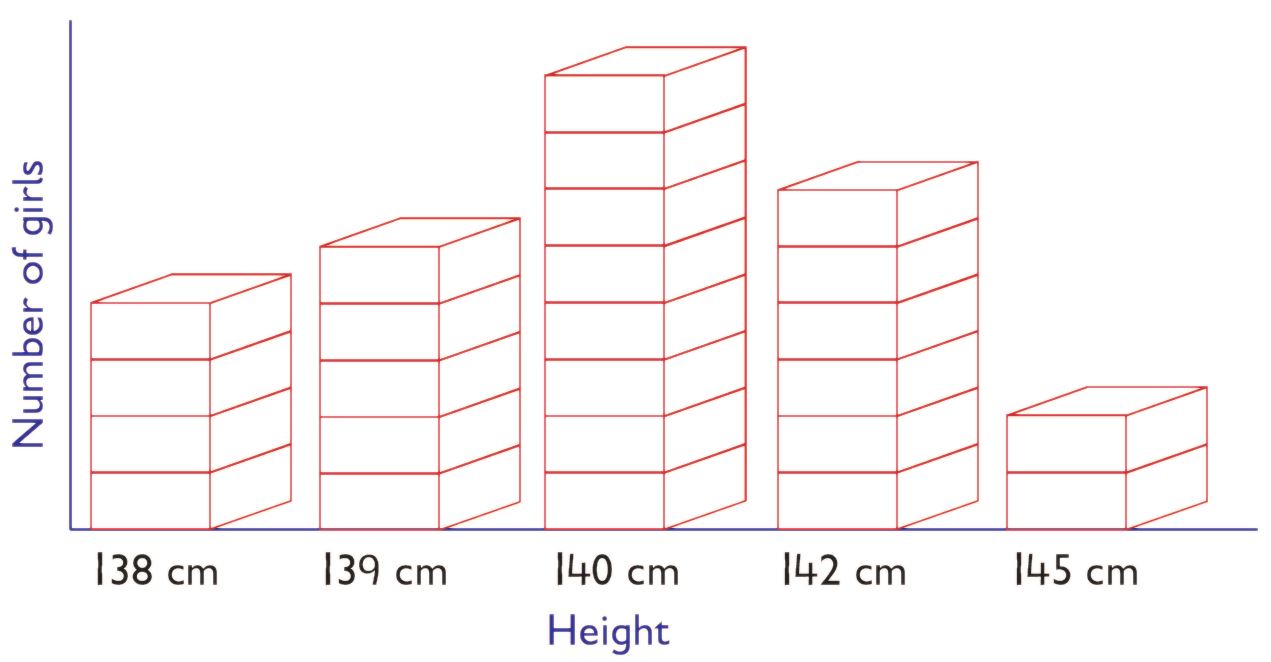
Mwadime measured the heights in centimetres of girls who played netball for Grade Five class. The results were represented as shown

Use the diagram to answer the following questions:

  1. Which was the most common height?
    Answer. The most common height was 140 cm.
  2. How many girls were 138 cm tall?
    Answer. There were 4 girls who were 138 cm tall.​
  3. How many girls were 139 cm and 145 cm tall?
    Answer
    There were 5 girls who were 139 cm tall.
    There were 2 girls who were 145 cm tall.
    Total number of girls was 5 + 2 = 7
  4. ​How many girls were above 139 cm?
    Answer
    ​Number of girls who were 140 cm tall were 8.
    ​Number of girls who were 142 cm tall were 6.
    ​Number of girls who were 145 cm tall were 2.
    ​Total number of girls were 8 + 6 + 2 = 16​​

Exercise F

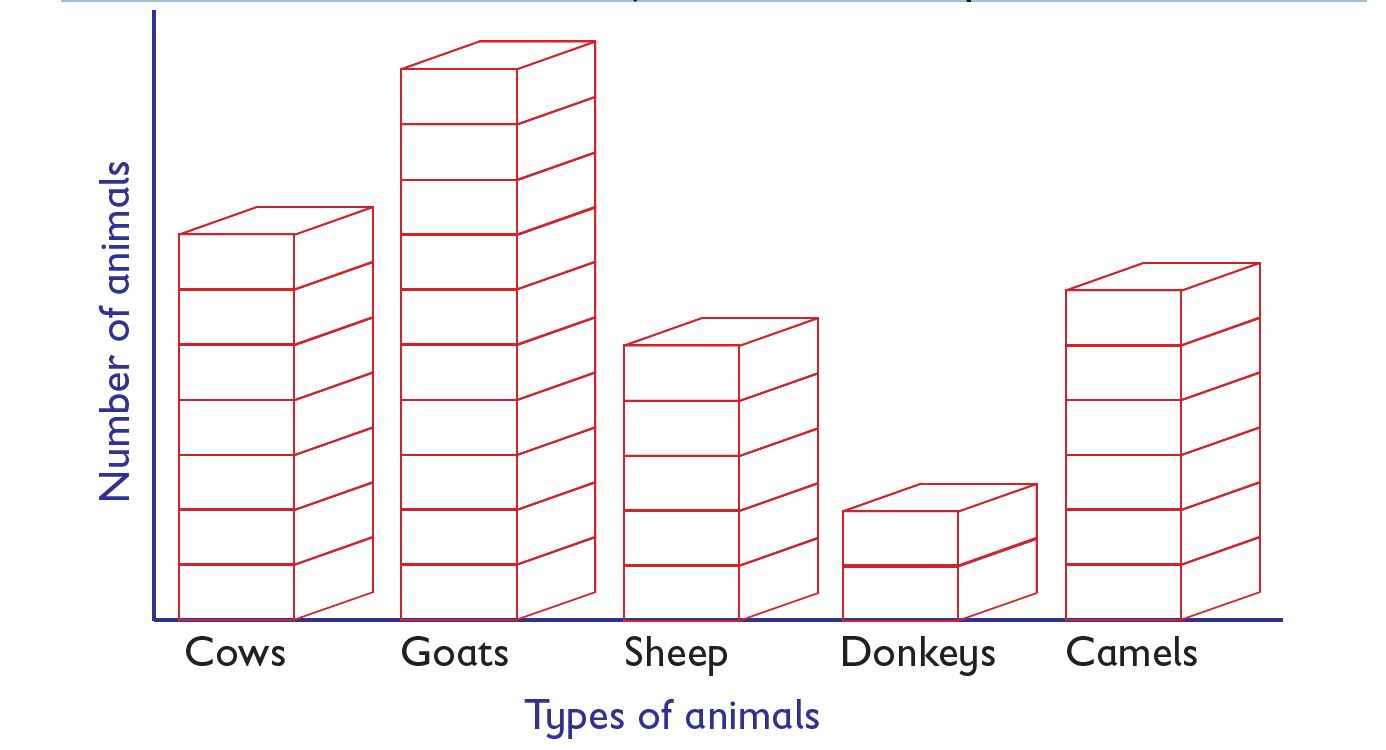
Use the diagram to answer the following questions:

  1. How many camels were in the farm?
    Answer
  2. Which animal was the most common?
    Answer
  3. How many more cows than sheep were in the farm?
    Answer more cows than sheep. 
  4. What was the total number of animals in the farm?
    Answer

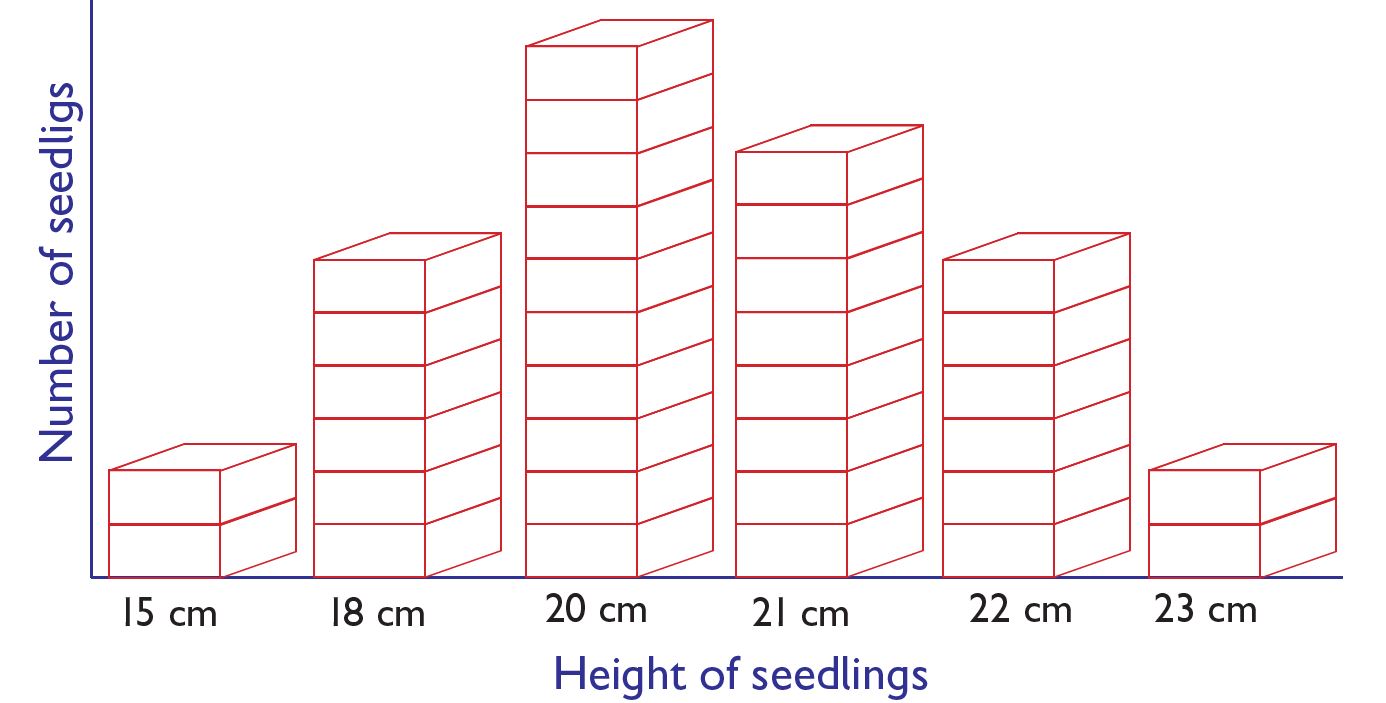
Use the diagram to answer the following questions:

  1. How many tree seedlings had a height of 20 cm?
    Answer
  2. How many tree seedlings were below 20 cm?
    Answer
  3. How many more tree seedlings were 22 cm tall than 23 cm tall?
    Answer
  4. How many tree seedlings did Karura measure the height?
    Answer

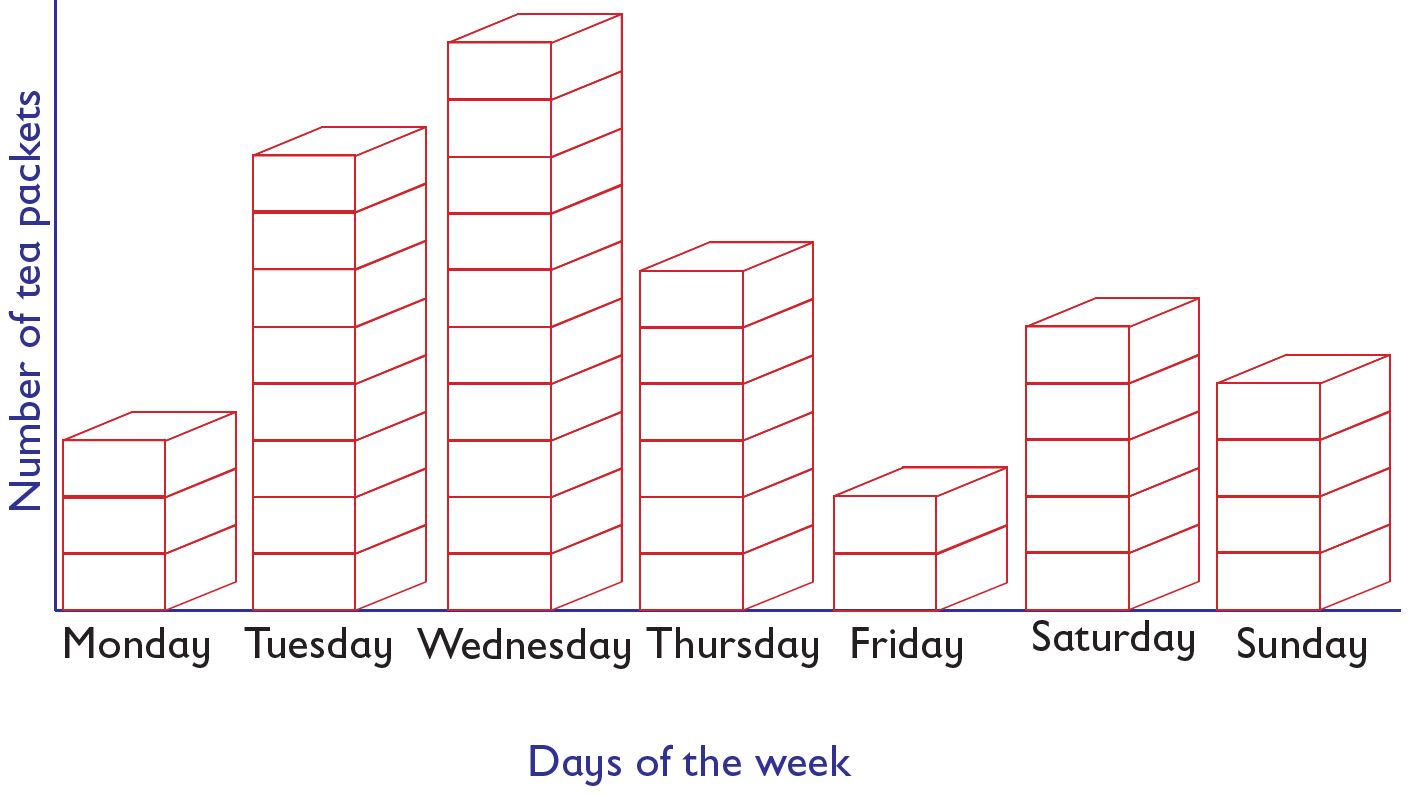
Use the diagram to answer the following questions:

  1. On which day did he sell the highest number of packets?
    Answer
  2. How many packets were sold on Tuesday?
    Answer
  3. On which day was the least number of packets sold?
    Answer
  4. How many more packets were sold on Tuesday than on Saturday?
    Answer

Digital Time

Video